

How it works · Price tracker
How prices are moving, every day.
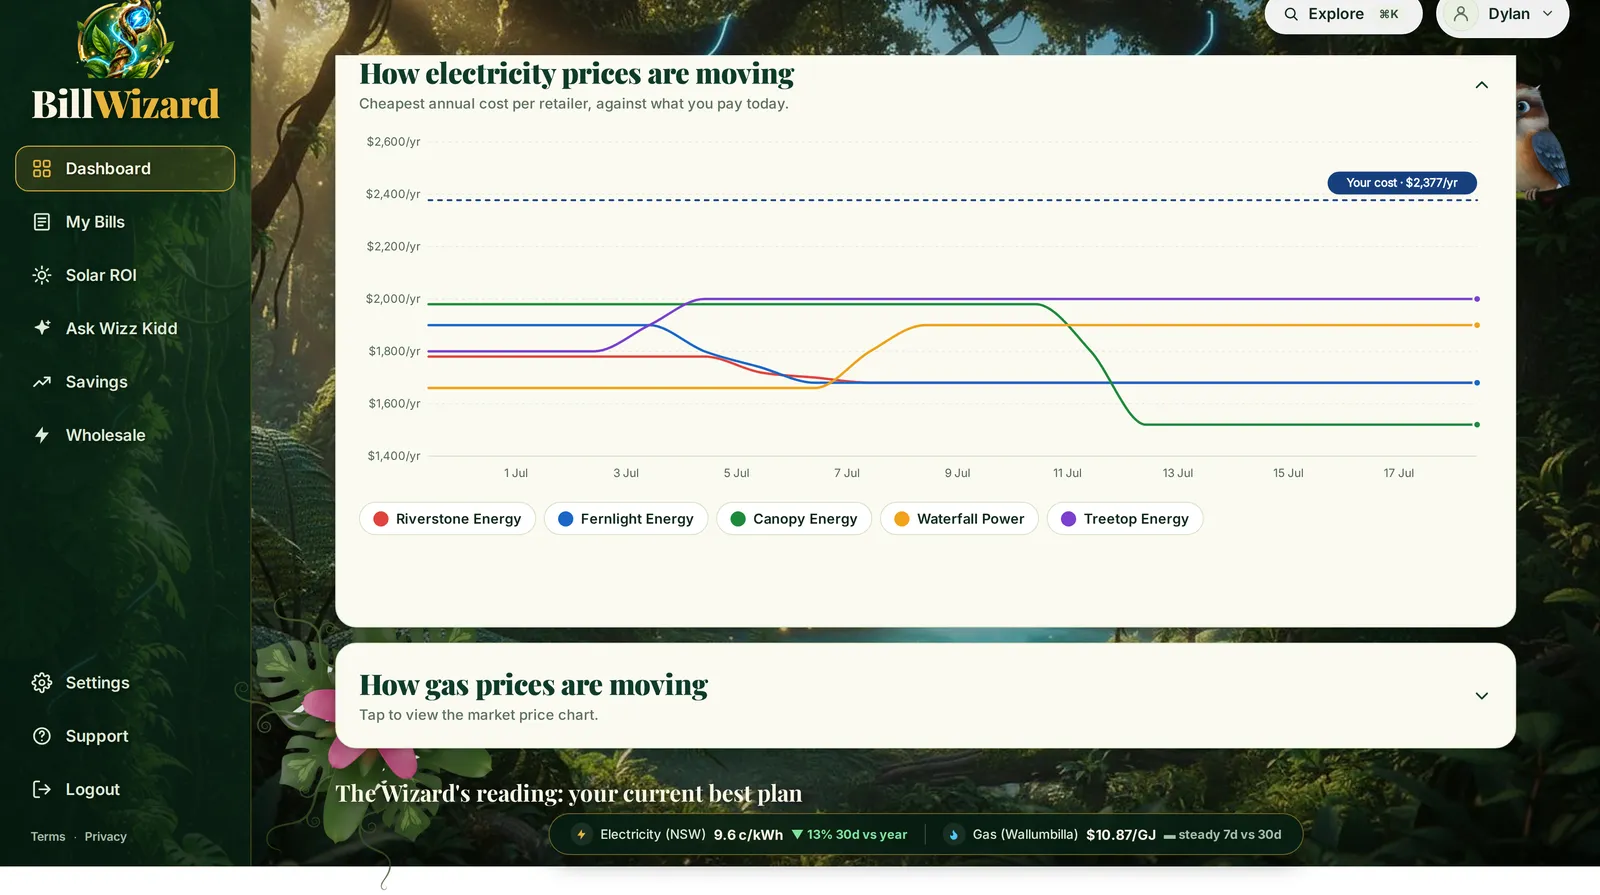
Plans change all the time. The tracker re-prices your usage daily and shows each retailer's cheapest offer against what you pay now.
What it shows
- Each retailer's cheapest offer for your usage, as a yearly cost, one line per retailer.
- Your cost as a dashed line across the chart, so the gap is easy to see.
- Electricity and gas, each on its own chart.
- How it's moved over the weeks you've been tracking.
Why daily matters
Retailers change prices and launch new plans through the year. A comparison done once goes stale. Because the Wizard keeps your figures, it can price the market for you again every day, and you can see when a better offer appears without uploading anything new.
Alongside the market pulse
Your dashboard also shows the wholesale electricity price in your state and the east-coast gas price, with how each has moved. More on wholesale prices.
Keep reading
More on how it works
BillWizard opens at the end of November.
Sign up and pay here, on billwizard.com.au. Until then, see what it does on How it works, or follow Software Cowboy on LinkedIn for launch day.